Financial highlights

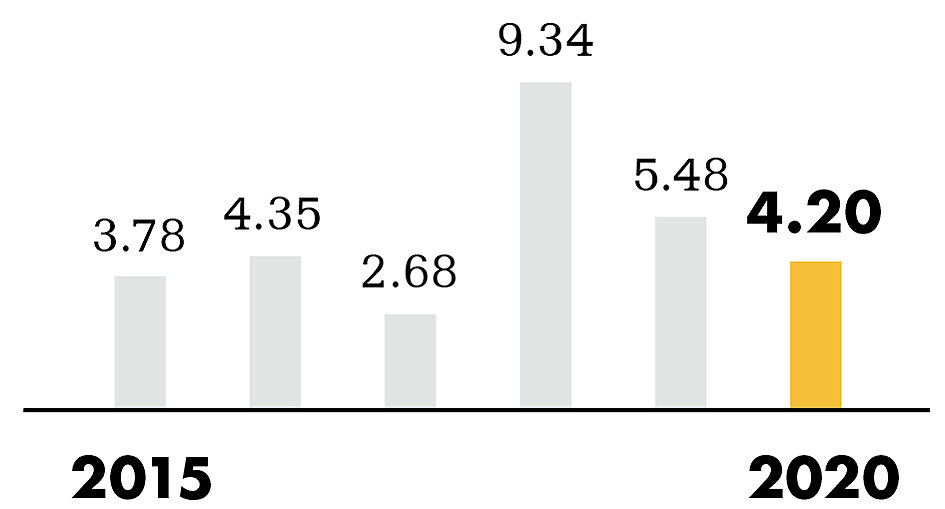
Net earning
$ per diluted share

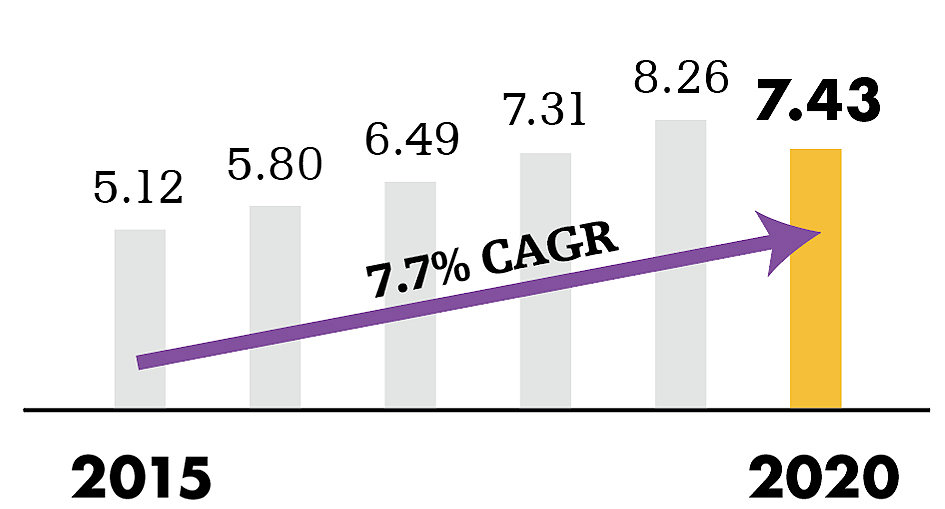
Adjusted net earnings*
$ per diluted share

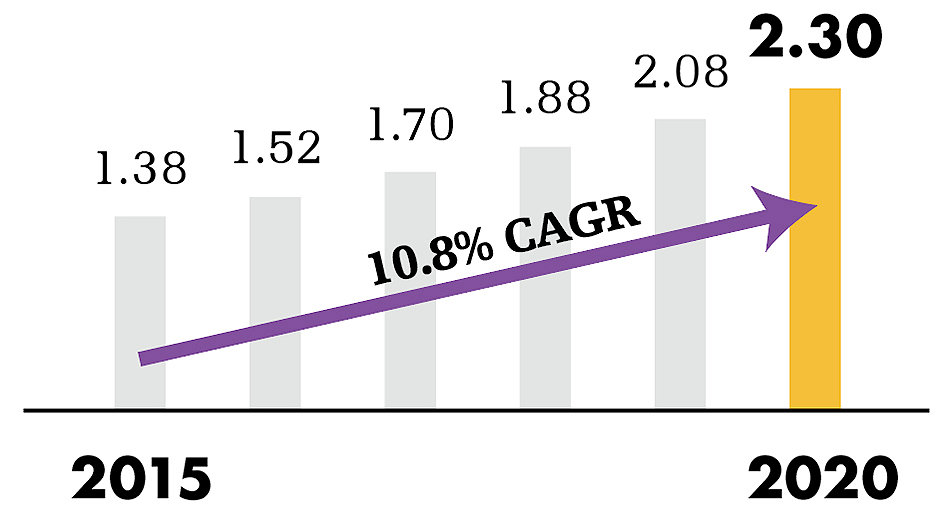
Dividends paid
$ per share of common stock


Financial overview
$ in millions, except per share amounts
$ in millions, except per share amounts
| 2020 | 2019 | % change | |
| Net sales | $14,351 | $14,884 | (3.6)% |
| Earnings before income taxes | 1,954 | 2,562 | (23.7)% |
| Income taxes | 355 | 479 | (25.9)% |
| Net earnings | 1,599 | 2,083 | (23.2)% |
| Adjusted net earnings¹ | 2,827 | 3,139 | (9.9)% |
| Net earnings per diluted share of common stock | |||
| Reported | $4.20 | $5.48 | (23.4)% |
| Adjusted* | 7.43 | 8.26 | (10.0)% |
| Dividends paid per share of common stock | $2.30 | $2.08 | 10.6% |
| Cash, cash equivalents and marketable securities | 3,024 | 4,425 | (31.7)% |
*Adjusted net earnings and adjusted net earnings per diluted share are non-GAAP financial measures. See below a reconciliation to the most directly comparable GAAP financial measures, net earnings and net earnings per diluted share.

Leading in medtech
Geographic net sales 2020
MedSurg
45%
18% Medical
13% Instruments
12% Endoscopy
2% Sustainability Solutions
Neurotechnology and Spine
21%
14% Neurotechnology
7% Spine
Orthopaedics
34%
12% Trauma & Extremities
11% Knees
8% Hips
3% Other

Reconciliation of the Most Directly Comparable GAAP Financial Measure to Non-GAAP Financial Measure
| Net earnings ($ millions) | Net earnings per diluted share | |||||||||||
|---|---|---|---|---|---|---|---|---|---|---|---|---|
| 2015 | 2016 | 2017 | 2018 | 2019 | 2020 | 2015 | 2016 | 2017 | 2018 | 2019 | 2020 | |
| Reported | $ 1,439 | $ 1,647 | $ 1,020 | $ 3,553 | $ 2,083 | $ 1,599 | $ 3.78 | $ 4.35 | $ 2.68 | $ 9.34 | $ 5.48 | $ 4.20 |
| Acquisition and integration-related charges | ||||||||||||
| Inventory stepped-up to fair value | 4 | 23 | 20 | 9 | 51 | 36 | 0.01 | 0.06 | 0.05 | 0.02 | 0.13 | 0.10 |
| Other acquisition and integration-related | 20 | 77 | 31 | 90 | 160 | 157 | 0.05 | 0.20 | 0.09 | 0.24 | 0.42 | 0.41 |
| Amortization of purchased intangible assets | 147 | 221 | 250 | 338 | 375 | 381 | 0.39 | 0.59 | 0.67 | 0.89 | 0.99 | 1.00 |
| Restructuring-related and other charges | 97 | 98 | 155 | 179 | 180 | 397 | 0.26 | 0.26 | 0.41 | 0.47 | 0.47 | 1.04 |
| Medical device regulations | - | - | - | 10 | 48 | 63 | - | - | - | 0.03 | 0.13 | 0.17 |
| Recall-related matters | 210 | 127 | 131 | 18 | 154 | 13 | 0.55 | 0.34 | 0.34 | 0.05 | 0.41 | 0.03 |
| Regulatory and legal matters | (46) | (7) | 25 | 141 | (33) | 8 | (0.12) | (0.02) | 0.06 | 0.37 | (0.09) | 0.02 |
| Tax Matters | 78 | 8 | 833 | (1,559) | 121 | 173 | 0.20 | 0.02 | 2.19 | (4.10) | 0.32 | 0.46 |
| Adjusted | $ 1,949 | $ 2,194 | $ 2,465 | $ 2,779 | $ 3,139 | $ 2,827 | $ 5.12 | $ 5.80 | $ 6.49 | $ 7.31 | $ 8.26 | $ 7.43 |
| Effective Tax Rate - Reported | 17.1% | 14.3% | 50.6% | (50.8%) | 18.7% | 18.2% | ||||||
| Effective Tax Rate - Adjusted | 17.3% | 17.3% | 15.6% | 16.7% | 15.8% | 12.6% | ||||||
| Weighted average diluted shares outstanding | 380.9 | 378.5 | 380.1 | 380.3 | 379.9 | 380.3 | ||||||
