- For Stryker’s complete
financials, view our 10-K »View Document
| 2008 | 2009 | % Change | |
|---|---|---|---|
1 Adjusted to exclude a patent litigation gain of $42.9 million ($0.11 per share) and income taxes on repatriation of foreign earnings of $67.1 million ($0.17 per share) recorded in 2009, as well as restructuring charges of $48.4 million ($0.12 per share) and $21.7 million ($0.05 per share) recorded in 2009 and 2008, respectively. |
|||
| Sales | $ 6,718.2 | $ 6,723.1 | 0.1 |
| Earnings before income taxes | 1,580.2 | 1,623.9 | 2.8 |
| Income taxes | 432.4 | 516.5 | 19.4 |
| Net earnings | 1,147.8 | 1,107.4 | (3.5) |
| Adjusted net earnings1 | 1,169.5 | 1,180.0 | 0.9 |
| Diluted net earnings per share of common stock: | |||
| Reported | $ 2.78 | $ 2.77 | (0.4) |
| Adjusted1 | $ 2.83 | $ 2.95 | 4.2 |
| Dividends paid per share of common stock | 0.33 | 0.50 | 51.5 |
| Cash and current marketable securities | 2,195.6 | 2,954.8 | 34.6 |
| 2003 | 2004 | 2005 | 2006 | 2007 | 2008 | 2009 | |
|---|---|---|---|---|---|---|---|
| Amount paid | — | 0.07 | 0.09 | 0.11 | 0.22 | 0.23 | 0.50 |
| 2003 | 2004 | 2005 | 2006 | 2007 | 2008 | 2009 | |
|---|---|---|---|---|---|---|---|
| Amount | 617 | 560 | 833 | 867 | 1,028 | 1,176 | 1,461 |
| 2003 | 2004 | 2005 | 2006 | 2007 | 2008 | 2009 | |
|---|---|---|---|---|---|---|---|
| Amount | 1.03 | 1.37 | 1.66 | 2.00 | 2.40 | 2.83 | 2.95 |
Adjusted to exclude certain charges and gains, including patent litigation, restructurings, intangible asset impairment,in-process research and development, income taxes on repatriation of foreign earnings, acquisition-related items and discontinued operations.
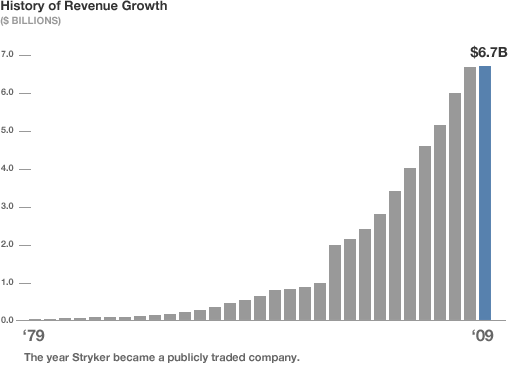
Worldwide Sales Growth: 2.4 Billion, International, 4.3 Billion, U.S., totaling 6.7 billion worldwide.

Diversified Sales Base
- Reconstructive Implants: 38%
- Hips: 16%
- Knees: 19%
- Extremity/Other: 3%
- Spine, Trauma & CMF Implants: 23%
- Trauma: 11%
- Spine: 9%
- CMF/Other: 3%
- Medical/Surgical: 39%
- Instruments: 18%
- Endoscopy: 14%
- Medical: 7%


