
| (In millions, except per share amounts) |
2011 |
2010 |
% CHANGE |
|
| Earnings before income taxes |
1,686 |
1,729 |
(2.5) |
| Net earnings |
1,345 |
1,273 |
5.7 |
| Adjusted net earnings1 |
1,448 |
1,329 |
9.0 |
| Reported |
$ 3.45 |
$ 3.19 |
8.2 |
|
| Adjusted1 |
3.72 |
3.33 |
11.7 |
| Net cash provided by operating activities |
$ 1,434 |
$ 1,547 |
(7.3) |
| Dividends paid per share of common stock |
$ 0.72 |
$ 0.60 |
20.0 |
| Cash and current marketable securities |
3,418 |
4,380 |
(22.0) |
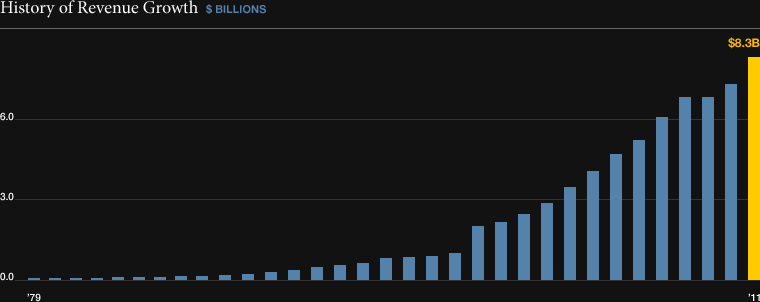
History Of Revenue Growth ($ Billions)
| Year |
Amount (In Billions) |
| 2011 |
8.3 |
| 2010 |
7.3 |
| 2009 |
6.7231 |
| 2008 |
6.7182 |
| 2007 |
6.0005 |
| 2006 |
5.1472 |
| 2005 |
4.6089 |
| 2004 |
4.0174 |
| 2003 |
3.4023 |
| 2002 |
2.8101 |
| 2001 |
2.4214 |
| 2000 |
2.1421 |
| 1999 |
1.9817 |
| 1998 |
0.9874 |
| 1997 |
0.8801 |
| 1996 |
0.8315 |
| 1995 |
0.8117 |
| 1994 |
0.6413 |
| 1993 |
0.5335 |
| 1992 |
0.4627 |
| 1991 |
0.358 |
| 1990 |
0.276 |
| 1989 |
0.2228 |
| 1988 |
0.177 |
| 1987 |
0.147 |
| 1986 |
0.1287 |
| 1985 |
0.1084 |
| 1984 |
0.0898 |
| 1983 |
0.0745 |
| 1982 |
0.0572 |
| 1981 |
0.0437 |
| 1980 |
0.0362 |
| 1979* |
0.029 |
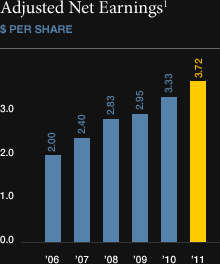
Adjusted Earnings Growth ($ Per Share)
| Year |
$ Per Share |
| 2011 |
3.72 |
| 2010 |
3.33 |
| 2009 |
2.95 |
| 2008 |
2.83 |
| 2007 |
2.40 |
| 2006 |
2.00 |
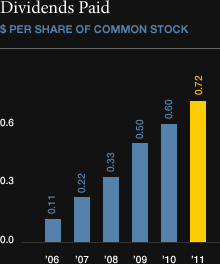
Dividends Paid ($ Per Share of Common Stock)
| Year |
Dividends Paid |
| 2011 |
0.72 |
| 2010 |
0.60 |
| 2009 |
0.50 |
| 2008 |
0.33 |
| 2007 |
0.22 |
| 2006 |
0.11 |
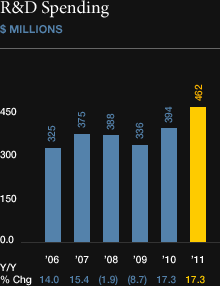
R&D Spending (% of Sales)
| Year |
% of Sales |
Year/Year % Change |
| 2011 |
462 |
17.3 |
| 2010 |
394 |
17.3 |
| 2009 |
336 |
(9.7) |
| 2008 |
388 |
(1.9) |
| 2007 |
375 |
15.4 |
| 2006 |
325 |
14.0 |